Three-Station Temperature Performance Comparison
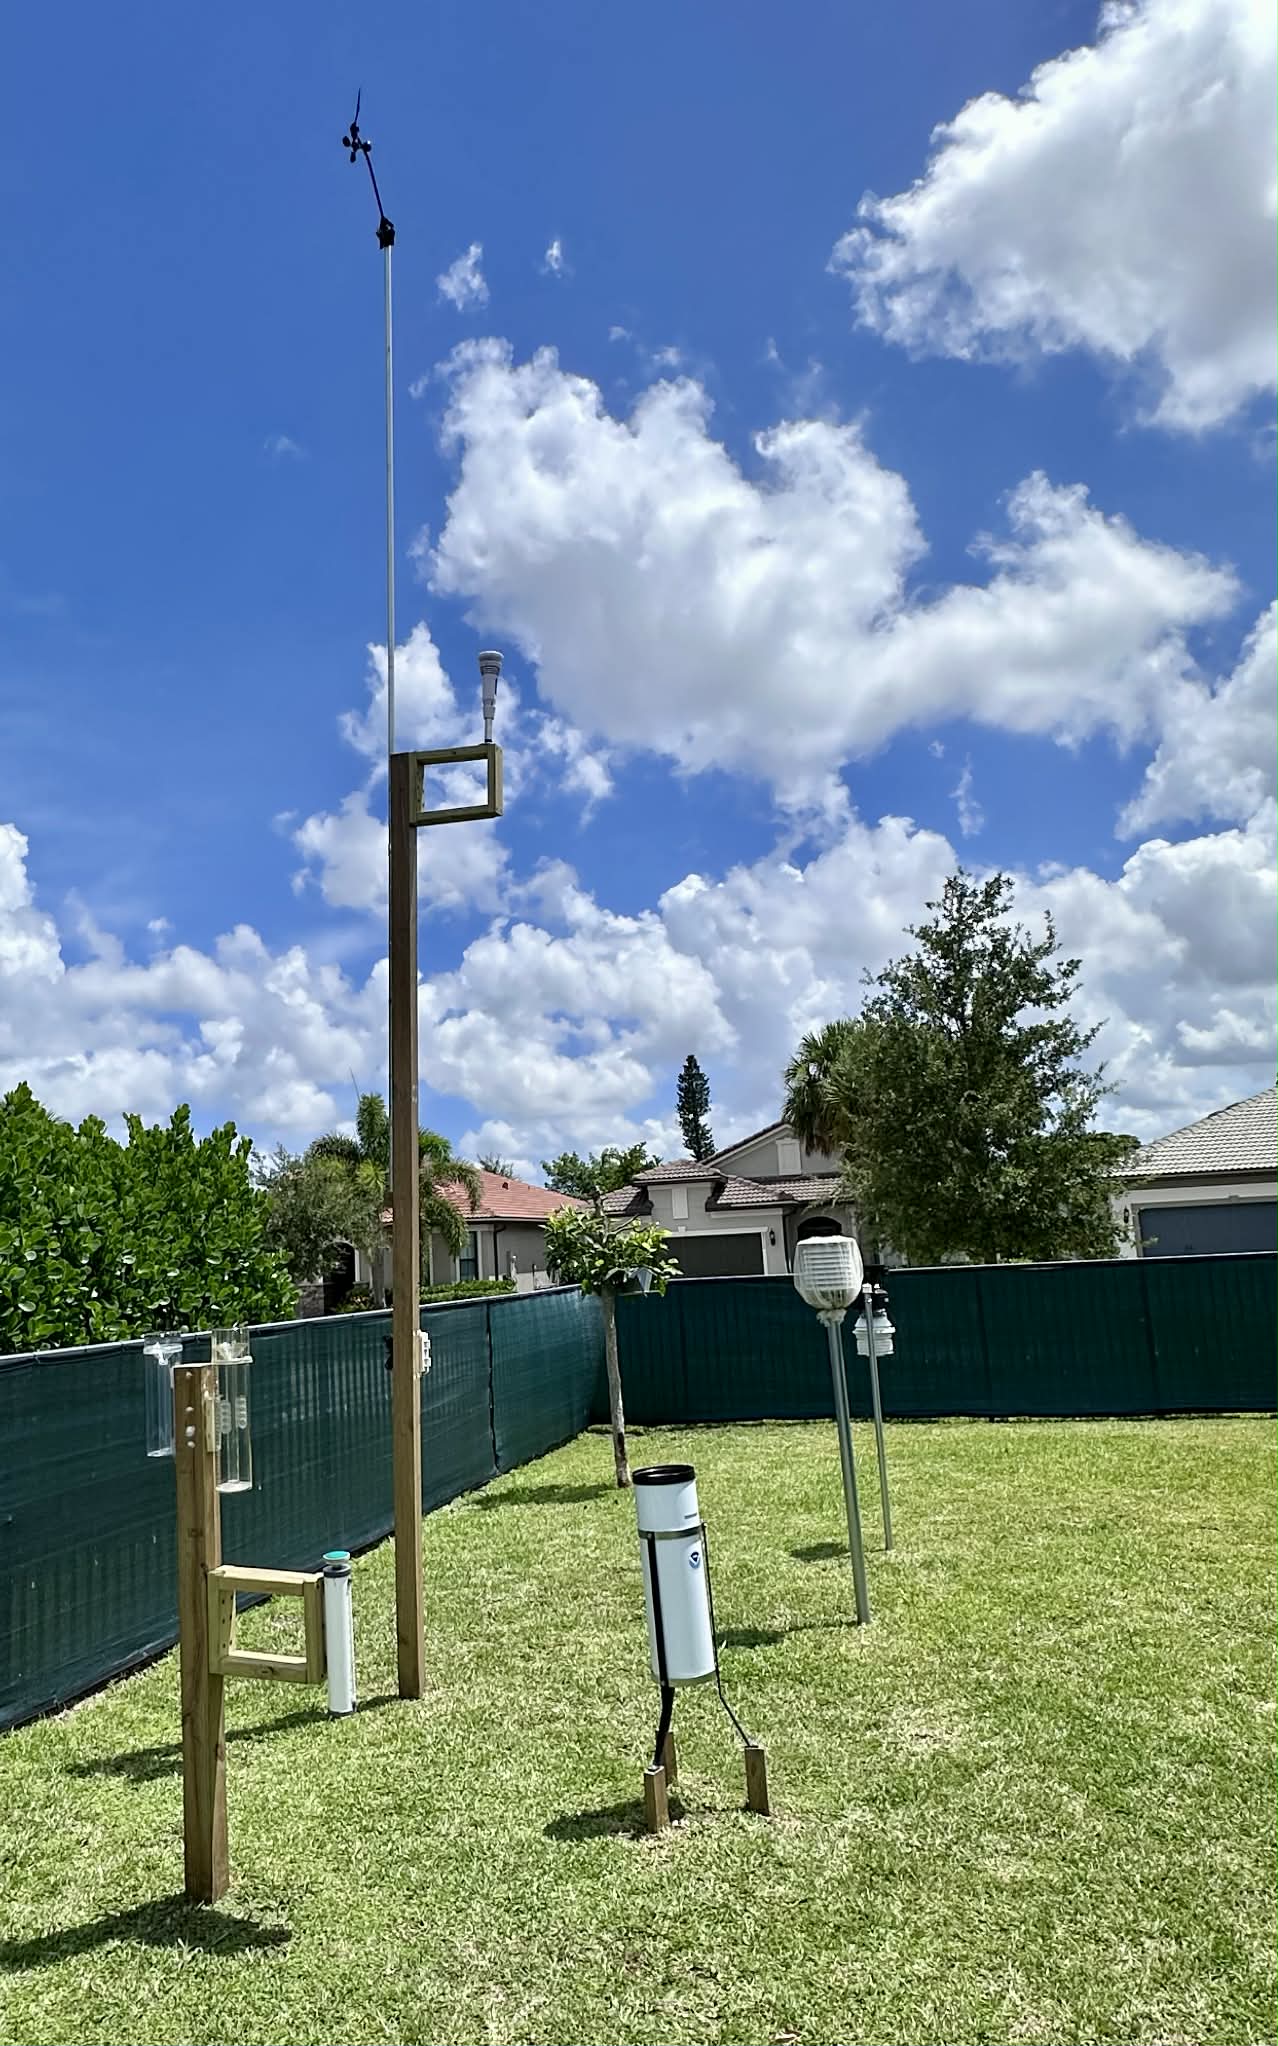
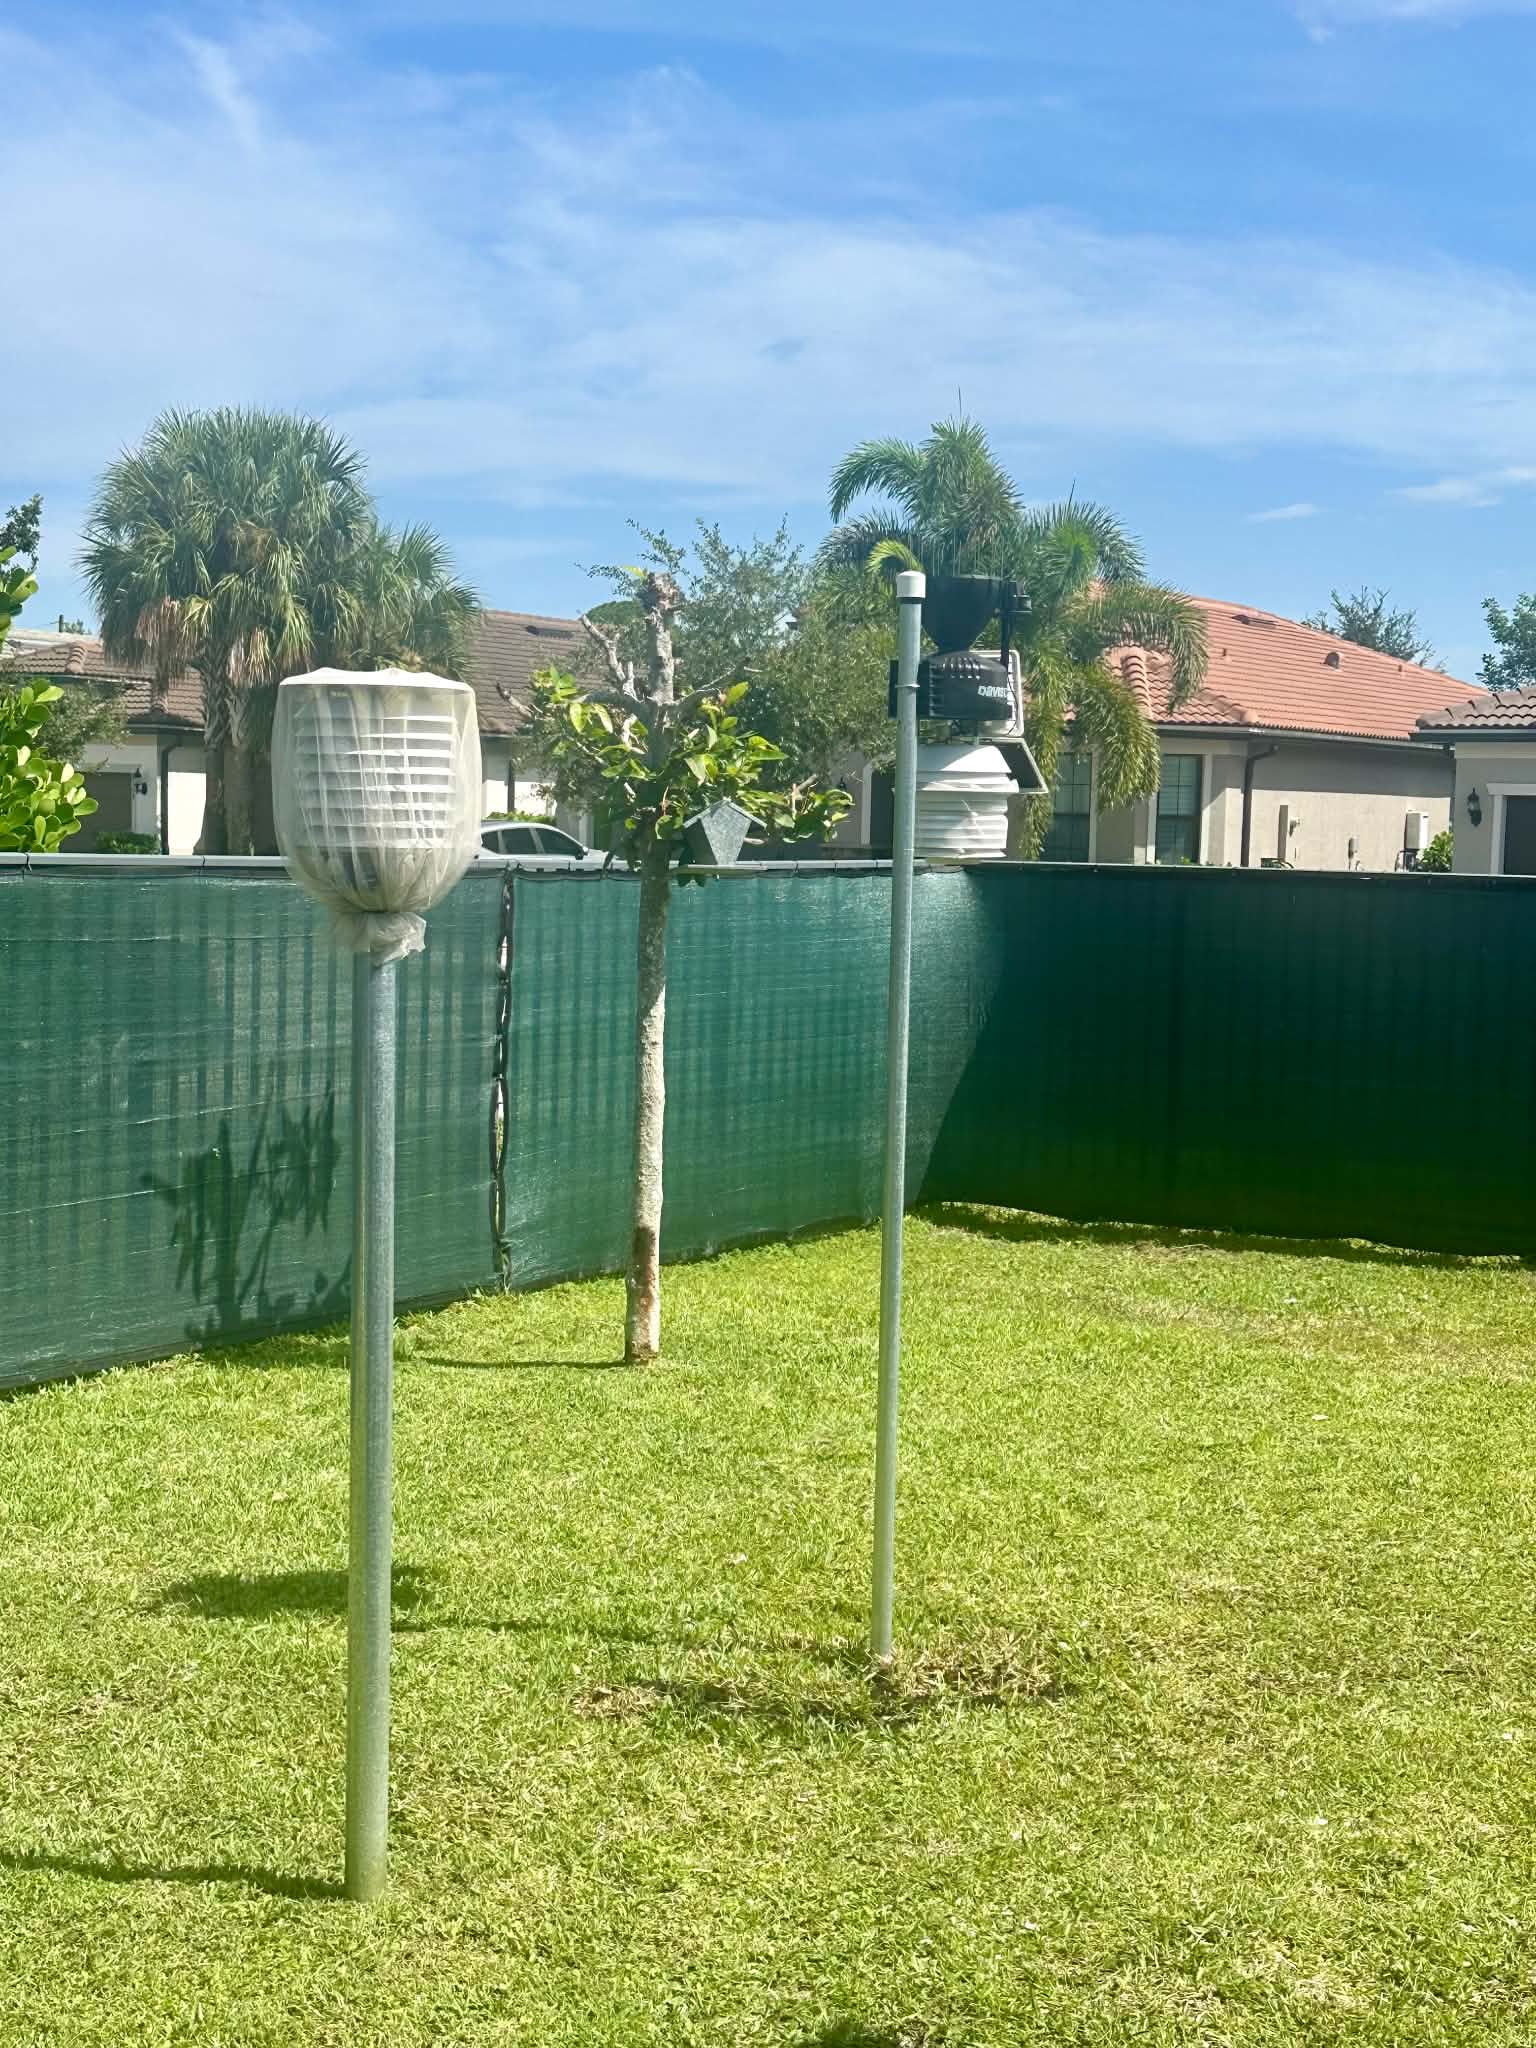
This chart compares continuous temperature observations from three instruments: the Davis Vantage Pro2 Plus (VP2), equipped with a daytime fan-aspirated radiation shield; the National Weather Service (NWS) Maximum/Minimum Temperature System (MMTS); and the WeatherFlow Tempest. The objective is to evaluate temperature differences among the three systems under varying environmental conditions, including solar radiation and wind. The live MMTS observation display can be viewed here. The sensor setup, including placement and exposure, can be viewed in this wide view and close up view. MMTS temperature observations are collected using an automated optical character recognition (OCR) system. A Raspberry Pi captures an image of the MMTS display every 10 seconds, and the reading from the first image captured each minute is extracted and stored in the website database, then plotted alongside the corresponding Davis VP2 temperature observations. The graph updates automatically every minute.